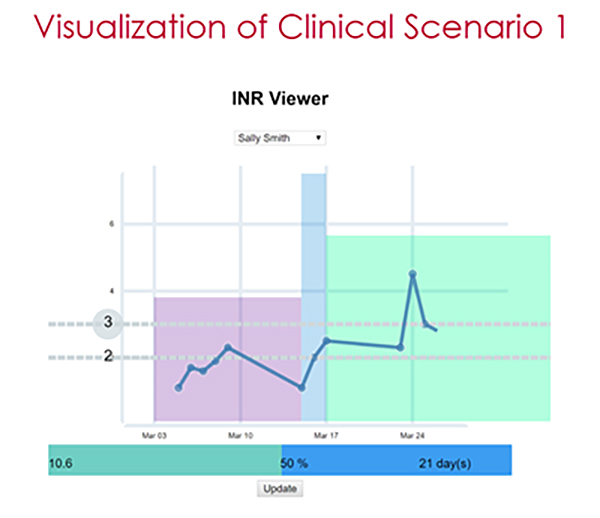
INR Viewer
In Partnership with ARUP Laboratories, IAB Member
Students: BEN CLYDE, YURONG OUYANG, JACOB WAN, HUAIZHONG PAN
Problem: Adjusting for Warfarin dosage requires constant monitoring of INR level. Clinicians can view INR level over time in most EHR, but most data display does not include other information (i.e. date of last adjustment) that may help clinicians to assess the patient’s overall condition.
Solution: An application that charts the patient’s INR level. The dates of dosage order adjustment are overlaid on top of the trendline. Reference ranges can be adjusted by users to fine tune the definition of normal ranges. The application calculates the number of days that are within normal ranges according to the user’s definition of reference ranges and display the percentage of normal days at the bottom.
Standards and Tools used: FHIR, React
