
Human Carotid Artery Plaque Imaging and Analysis
Atherosclerotic disease of the cervical carotid artery is one of the greatest causes of embolic stroke. Many strokes could be prevented if high-risk carotid artery lesions (plaque) could be detected and treated early. Unlike X-rays, MRI (Magnetic Resonance Imaging) techniques can be used to detect disease, discriminate between different types of soft tissue and plaque components, and classify subjects who will benefit from interventions. The following is a project addressing one aspect of this research.
Project: Measurement of the Mean ADC Values of Lipid, Hemorrhage and Overall Wall Components Using In-Vivo Human Carotid Artery Diffusion Weighted Imaging (DWI)
Introduction
The development of atherosclerotic plaques is a complex process. Plaques are composed of lipid, necrotic tissue, loose connective tissue, hemorrhage, and calcification. Lipids and hemorrhage are often difficult to distinguish from other plaque components by MRI. Ex-vivo studies indicate that diffusion weighted imaging (DWI) may help characterize these components. We have previously reported in-vivo DWI of human carotid artery using a 2D ss-IMIV DWEPI sequence (Kim SE, et al. JMRM 2009;30:1068.) This study reports the Apparent Diffusion Coefficient (ADC) values of lipid, hemorrhage and normal wall as measured with in-vivo DWI, with histology used as the basis for comparison.
Methods
DWI Data Acquisition
All studies were performed on a Siemens Trio 3T with our home built bilateral phased array carotid coil. Human carotid arteries centered at the bifurcation apex were scanned with 2D ss-IMIV-DWEPI. 2D TSE and 3D MPRAGE sequence scans were performed at the same slice locations.
ADC Measurements
ADC maps were calculated and displayed using algorithms developed in IDL (ITT, Boulder, CO). 33 slices of ADC maps created from DWI from 11 subjects were selected for the measurement of the mean ADC values in a vessel wall. 18 slices had corresponding histology from carotid endarterectomy. Mean ADC values of a lipid core or a hemorrhage were measured from ADC maps of only six subjects whose CEA specimens were obtained. Plaque components traced from each histology slide were mapped to the corresponding ADC map slice
CEA Processing and Evaluation
Six human CEA specimens were obtained and fixed in 10% neutral buffered formalin for 3 days and decalcified. Tissue cassettes were processed on the automated VIP, embedded in paraffin wax, sectioned at 3-4 mm intervals and stained with a CME and hematoxylin and eosin (H&E). Plaque components were traced as regions of interest and histologic slides were matched with in vivo MR images Plaque components traced from each histology slide were mapped to the corresponding ADC map slice.
Results
ADC value on Plaque Components
The mean vessel wall ADC was 1.28±0.09x10⁻³ mm2/s.
The mean ADC values of lipid, hemorrhage, and overall wall composition are summarized in Table 2.
| Table 2: Mean ADC value on Plaque Components | |||
|---|---|---|---|
| ADC | Vessel Wall | Lipid Core | Hemorrhage |
| (10-3 mm2/s) | 1.28±0.09 | 0.29±0.09 | 0.49±0.08 |
The mean ADC values of lipid, hemorrhage, and normal vessel wall are statistically significant from one another.
Fig 1 ADC Maps of a Subject with Hemorrhage
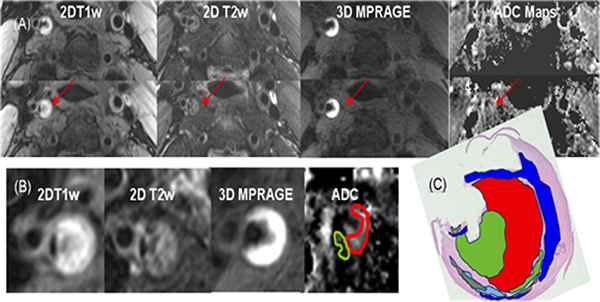
(C): Histology confirmed that this area represents recent intraplaque hemorrhage (red area).
Fig 2 ADC Maps of a Subject with Lipid Core
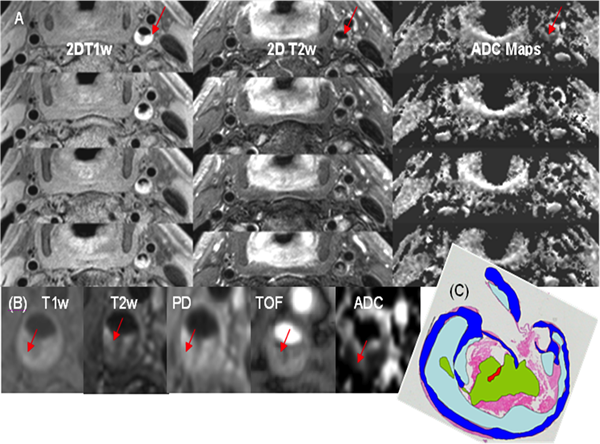
(B): The plaque area indicated with red arrows is hyperintense on T1w, intermediate intensity on T2w and demonstrates a low ADC value (0.42x10⁻³ mm2/s).
(C): The lipid rich component indicated by light blue color on the annotated histology slide is spatially well matched with the low signal area of the ADC map.
Conclusions
The results obtained indicate that an ADC map may be of substantial value in identifying lipid, hemorrhage, and overall wall plaque burden. Our ADC values obtained using the 2D ss IMIV DWEPI technique match previously reported ADC value in ex-vivo studies (5-8). No in vivo studies have reported ADC values for these plaque components. This technique can potentially be applied to further investigate the ADC of other plaque components.
Authors
Seong-Eun Kim (1,2), Scott McNally (2), Laura K. Findeiss (2), Jordan Hulet (4), Eun-Kee Jeong (1,2), John A Roberts (1,2), Gerald S Treiman (3,5), Dennis L Parker (1,2)
- Utah Center for Advanced Imaging Research
- Department of Radiology
- Surgery
- Biomedical Informatics
- Department of Veterans Affairs, VASLCHCS, Salt Lake City, Utah