By Michael Mozdy

“Control your costs” is a maxim for any organization – from nonprofits to Fortune 100 companies – and healthcare should be no exception. Given the complexity of health care delivery, the question of how much our services cost has been perplexing. That is, until Dr. Vivian Lee became our Senior VP for Health Sciences five years ago.
Dr. Lee holds a simple belief: in order to help lead the transformation of healthcare, we must have a strong understanding of our costs. The value equation that she champions has three factors: high quality of care, excellent service to our patients, and low costs. Traditionally, we’ve been fairly good at knowing metrics for quality, and we have championed the measurement and public publishing of our providers’ patient experience scores. Cost information, however, has been lacking. We set out to change this.
The radiology department has embraced this journey, and we’ve recently published our first complete costing study in the February 2017 issue of Academic Radiology. Dr. Yoshimi Anzai is first author on the study, which describes the work done by a team of physicians, financial administrators, our system’s value engineers, radiology leadership, external consultants, and many others. The team used a cost-accounting tool developed at the Harvard Business School called Time-Driven Activity-Based Costing (TDABC). They applied TDABC to discover the costs of an abdomen and pelvis computed tomography (AP CT) scan, one of the most commonly ordered scans.
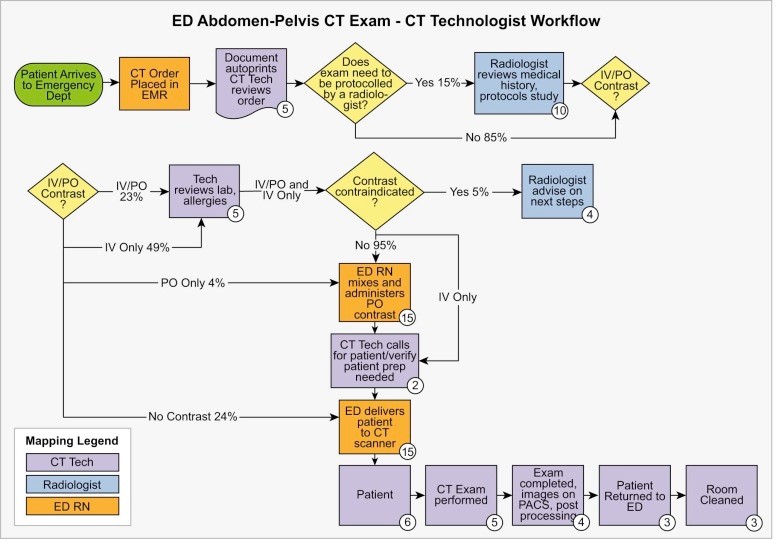
Applying TDABC to an imaging test is not a quick task. First, the team mapped out three distinct workflows to understand every step involved from ordering the scan to the radiologist’s final interpretation. They described all of the clinical and administrative process steps — the duration of each activity and the clinical resources (such as personnel and equipment) involved in a patient's complete cycle of care.
The team analyzed three separate workflows: when the patient is referred from the outpatient setting, from the emergency department, and from the inpatient setting. The ED is the most common referral source, accounting for 56% of the total scans. The process map for the ED setting is below.
Next, Kirk Mosher, MBA, Radiology’s financial administrator determined a cost-per-minute “capacity cost rate” for each clinical resource involved in the care cycle. This cost included personnel, space, supplies, and equipment.
The results were interesting: the cost of an AP CT ordered from the inpatient setting were much higher than the other two, with the non-radiology personnel cost over double that of an outpatient AP CT.
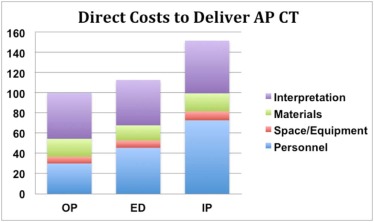
Since inpatient AP CT scans only account for 19% of the total volume of scans done, the average personnel costs (including interpreting radiologists) for the institution were around 80% of the total cost of the AP CT scan – still clearly the largest contributor of cost.
The authors identify multiple opportunities to reduce costs: using lower cost resources when clinically appropriate, streamlining the ordering system to clarify medical necessity and clinical indications, more efficient utilization of the CT scanner, and reducing the wait time between patients. Noting that 40% of the costs were attributable to non-radiologic personnel, the authors state, “Replacing some of the roles performed by CT technologists or nurses with medical assistants may reduce the overall costs of CT study without compromising quality of care.”
Reflecting on the work, Mosher says, “TDABC is an interesting and useful methodology, and we’ve applied it to understand our costs in other areas like mammography.” Studies like these help us better understand and control our costs, and just as importantly, demonstrate how University of Utah Health Care is ultimately concerned about providing the best value for patients we serve.
Read the full journal article here.