By Michael Mozdy
For several decades, MRI researchers in our department have forged a particularly fruitful collaboration with our University of Utah cardiologists, namely Brent Wilson, MD, PhD, Nassir Marrouche, MD, and Christopher McGann, MD. Our cardiac MRI program, begun in 2001 with collaborations between McGann and Ed DiBella, PhD, has delivered advancements in healthcare for a vital but tricky-to-image organ.
When he was hired on about a decade ago, Nassir Marrouche approached the director of UCAIR at that time, Dennis Parker, PhD, and DiBella as well as other researchers in the health sciences to form the Comprehensive Arrhythmia Research and Management Center (CARMA). Marrouche was especially interested in atrial fibrillation, or AFib, and he needed a better way to noninvasively image the heart to move treatments forward. Our cardiac MRI team stepped up to the challenge, and to this day they pursue several research tracks to improve cardiac imaging.
One project led to seminal papers published in Circulation and the Journal of the American Medical Association and is redefining our understanding of what causes AFib. Much of this was made possible thanks to a thin, quiet faculty member of the Department of Radiology and Imaging Sciences, a transplant from Russia named Eugene Kholmovski, PhD.
Our Internal Electric Motor
We are accustomed to thinking of the heart as one of the hardest working muscles in the body, but we may forget that the reason it works so hard is that it is being hit with a 1mV electrical pulse 86,400 times a day. The heart is a well-coordinated blood pumping motor, converting electrical energy into mechanical energy – 2.5 billion times if you live to the age of 80!
The heart’s natural pacemaker, a small 1-2 cm cluster of fibers called the sinoatrial (SA) node, generates the electrical signal that starts the cascade we know as the heartbeat. The SA node is located at the top of the heart, within the wall of the right atrium. Its electrical pulse makes the top chambers, the atria, contract. At the same time, this pulse triggers the atrioventricular node lower in the heart to stimulate specialized conducting fibers wrapping around the lower ventricles of the heart. This cascade of electrical signals down and through the heart tissue create the pattern of first atria, then ventricles, contracting and sending blood to the rest of the body.
Several things could go wrong in this cascade. AFib happens when the signal from the SA node doesn’t coordinate well with the rest of the heart. The normal cascade of electrical signal is interrupted and scattered within the heart muscle, which causes the chambers of the heart contract in a way that makes a person feel like his or her heart is “fluttering.”
AFib is serious: it doubles the risk of heart-related deaths and is associated with a 5-fold increased risk for stroke.
Cardiologists have known for some time that the vast majority of AFib is accompanied by abnormal tissue growing in the junction of the pulmonary veins and the left atrium. This tissue doesn’t conduct the electrical impulse as well as normal myocardial tissue, so the left atrium sporadically contracts slightly later than it should, causing the “fluttering” effect.
Cardiologists found that if they ablate, or burn, the tissue in this area, most people no longer have AFib. It seems that “cooked,” completely non-conductive tissue is better than tissue that is partially conductive. The procedure is minimally invasive – a radiofrequency probe is inserted into the heart with a long catheter. The patient needs to be sedated, however, and in order to ablate the correct area, the location of the pulmonary veins needs to be accurately mapped. It is also important to see the extent of the ablation when the procedure is complete. These steps greatly increase the time of the procedure if they are done with invasive venography.
Cardiologists needed a better, non-invasive way to map the left atrium and pulmonary veins and see the results of ablation. MRI was beginning to be used in other parts of the country and Marrouche set the challenge to Kholmovski to improve the technique.
Capturing Quicksilver
The heart is a particularly tricky organ to image because it jumps around in a patient’s chest. Not only do cardiac contractions move the heart, but our lungs expanding and deflating when we breathe also move the chest cavity. A good cardiac MRI must correct for both cardiac and respiratory motion or the result will be blurry. Add to this the fact that the left atrium is small and very thin walled compared to, for instance, the left ventricle, which is responsible for pumping blood throughout the body. The left atrium wall is 1.5-2 millimeters thick while the left ventricle is about 1.3 centimeters thick. The wall is particularly important because that’s where the pulmonary veins connect. Cardiologists needed a high-resolution, clear picture of a small, moving, thin-walled piece of anatomy.
 |
| Cardiologist Nassir Marrouche, MD. |
Kholmovski thought it wasn’t possible. “One nice thing about Marrouche,” he laughs, “is that he’s persistent where I’m skeptical. I’ll always find a reason to say ‘we cannot do this crazy thing.’ It’s nice to work with someone who has vision and is encouraging.”
To correct for cardiac motion, the team decided to only acquire data when the heart is relaxed (called the “diastole”) – at a regular time in the cycle. The left atrium is only stationary for about 15-20% of the time in between contractions. Their fast data acquisition method captures about 30 rows of data in the diastole phase of a normal heartbeat (about once a second). In order to capture enough data to create a 3D, high-resolution image of the left atrium, they need about 10,000 rows.
To correct for respiratory motion, researchers had figured out that they can measure the positon of the diaphragm just before acquiring the imaging data. Then, they compare that position to the previous measurements and if it matches, they keep the data. If not, they disregard that data, and try again the next heartbeat. The respiratory measurement matches about half of the time, so if you do the math, a complete, high-resolution scan that corrects for both cardiac motion and respiratory motion takes 7-10 minutes.
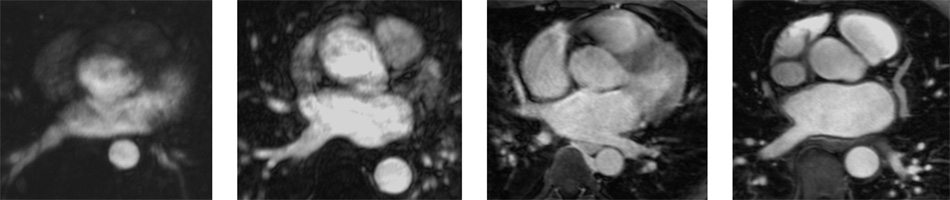 |
| Examples of an MRI cross-section of the heart showing the left atrium and other chambers, increasing in clarity from left to right. Notice how the rightmost image has uniform contrast, clear boundaries, and no motion artifacts. Images: Eugene Kholmovski, PhD. |
As if this wasn’t tricky enough, they found stray “artifacts” marring the image and discovered these were coming from the radiofrequency pulses applied to get the respiratory measurement. Kholmovski came up with a new, optimal combination of pulses and the bright idea to move the respiratory measurement to just after the data acquisition rather than before it. This change removed the artifacts. He also introduced a number of other tweaks to the data acquisition piece of the puzzle to create a clear picture of the atrial wall. They began to refer affectionately to his work as the “Eugene sequence.”
An example of a sharp cardiac MRI created by the Eugene Sequence.
Switching to DECAAF
After lots of time and testing, the CARMA collaborators were happy with their new non-invasive way to get images of the left atrium and the pulmonary veins. Faculty from the U’s Scientific Computing Institute (SCI) took the data gathered by the Eugene sequence and created vibrant 3D models for the cardiologists that mapped out regions of concern.
 |
| The CARMA team. |
Marrouche, Wilson, and McGann began to use the sequence and models for their AFib patients. Thanks to the way scar tissue holds the MRI contrast agent longer than normal tissue, they were able to see how much scarring occurred due to ablation and how that related to patient outcomes.
One day, as Kholmovski was reviewing the images emerging from the Eugene sequence, he remarked to Marrouche that one patient had an extensive amount of scar tissue in the left atrium – far above average for the procedure. The two researchers looked more closely at the scan and realized that these images were actually taken before the ablation was done. It wasn’t long before they realized that what they thought was ablation scarring was actually cardiac fibrosis. The AFib plot thickened.
Fibrosis is the accumulation of extracellular matrix – a collection of molecules secreted in tissue often to help the tissue heal – and it happens over time to many organs in the body. A major component of fibrosis is collagen, a protein found in bone, cartilage, tendons, and much more. Collagen is actually the most abundant protein in the human body. While the body may use extracellular matrix for structural and biochemical support of the surrounding cells, it has consequences as it builds up. Extensive cardiac fibrosis is found in most forms of heart disease, just like renal fibrosis is linked to most forms of kidney disease.
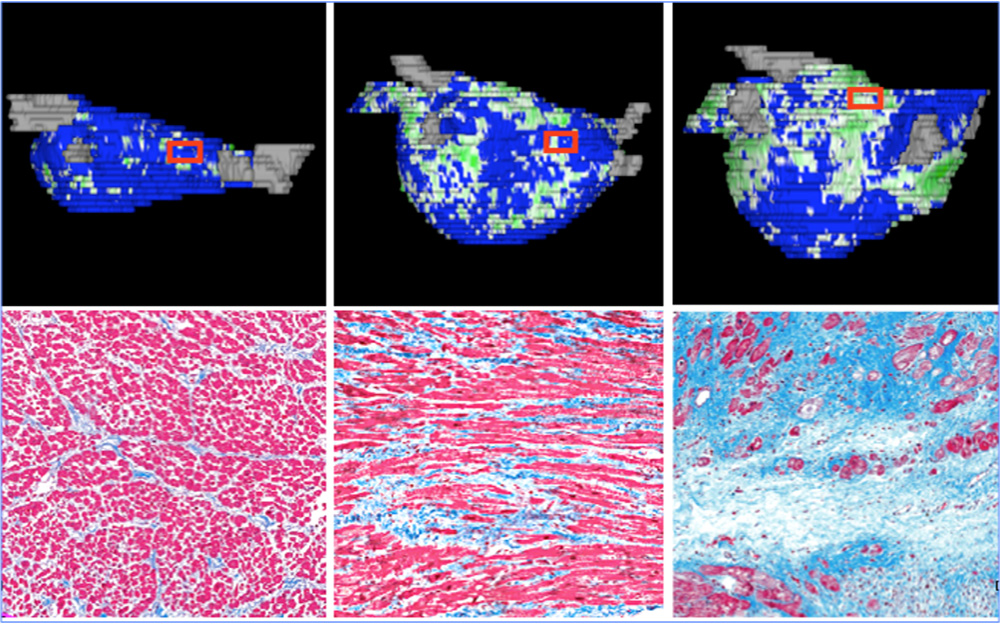 |
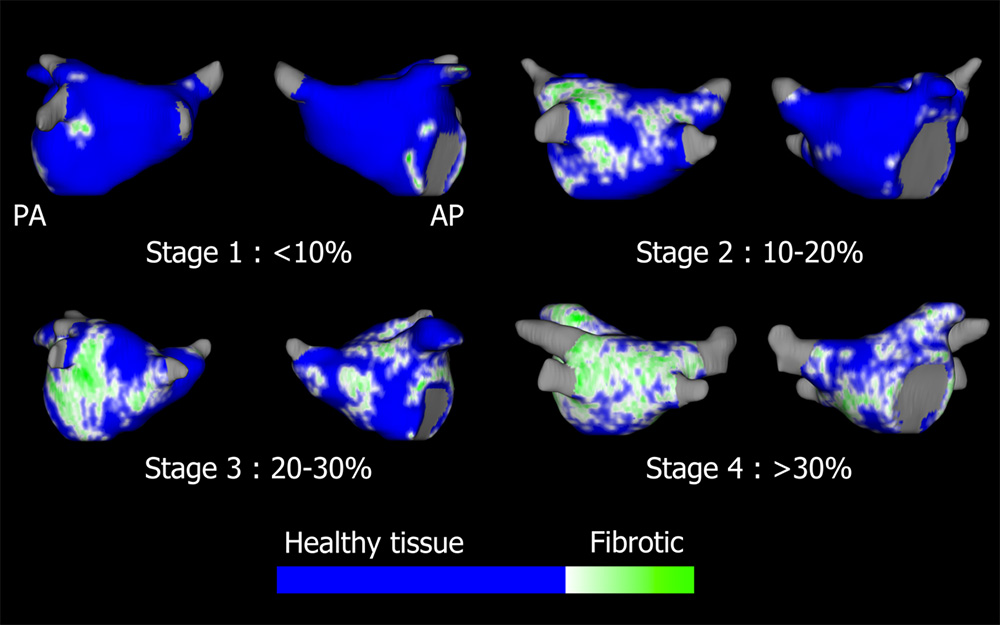
| Examples of how fibrosis looks on 3D models and its corresponding cellular structure under microscopy. From left-to-right: slight fibrosis, moderate fibrosis, and extensive fibrosis. From: McGann, Kholmovski, Wilson, DiBella, Parker, Marrouche et al. Circ Arrhythm Electrophysiol. 2014 Feb;7(1):23-30. |
The cardiologists suspected that the electrical conductivity problems present in AFib might be in part related to fibrosis. It stood to reason that, just like the abnormal tissue growing in the junction of the pulmonary veins, accumulation of extracellular matrix would disrupt the normal electrical conductivity of heart muscle.
Marrouche, Kholmovski, and team launched what they called the DECAAF study, which stands for Delayed-Enhancement MRI (DE-MRI) Determinant of Successful Radiofrequency Catheter Ablation of Atrial Fibrillation (if you remove a few letters). Fifteen institutions across the globe studied 339 patients for a year and looked at how their levels of fibrosis correlated with their long-term outcomes. They discovered for the first time that high levels of fibrosis are independently correlated with recurring arrhythmia (JAMA. 2014 Feb 5;311(5):498-506. doi: 10.1001/jama.2014.3.). In other words, cardiac fibrosis itself needs to be a target of concern, not just the abnormal tissue near the pulmonary veins. They created a classification for the amount of fibrosis found on the atrium, known to this day as the “Utah Classification.”
In order for the multi-center study to take place, Kholmovski needed to take the custom Eugene sequence to the MRI manufacturer Siemens and help them install it in a software package that could be used around the world. As the CARMA Center now launches DECAAF II to study the effectiveness of directly ablating regions of fibrosis to cut them off from the rest of the heart muscle, Kholmovski has had to increase his worldwide travel to upload his sequence to other MRI manufacturers like GE and Philips. He is also training MRI personnel how to image the left atrium correctly at more than 40 DECAAF II sites.
 |
It’s a challenge he enjoys as he has to learn how to translate his work to entirely new systems. “While Siemens is Windows-based and they program in C++,” he explains, “GE is UNIX and they use C programming. All of the hundreds of MRI parameters have different names, too.”
Kholmovski considers himself fortunate to work on systems that have such a real impact on health. “The CARMA team is interested in getting clinically relevant info to help patients today. My work is not just to make techniques to get nice images and publish a paper,” he says.
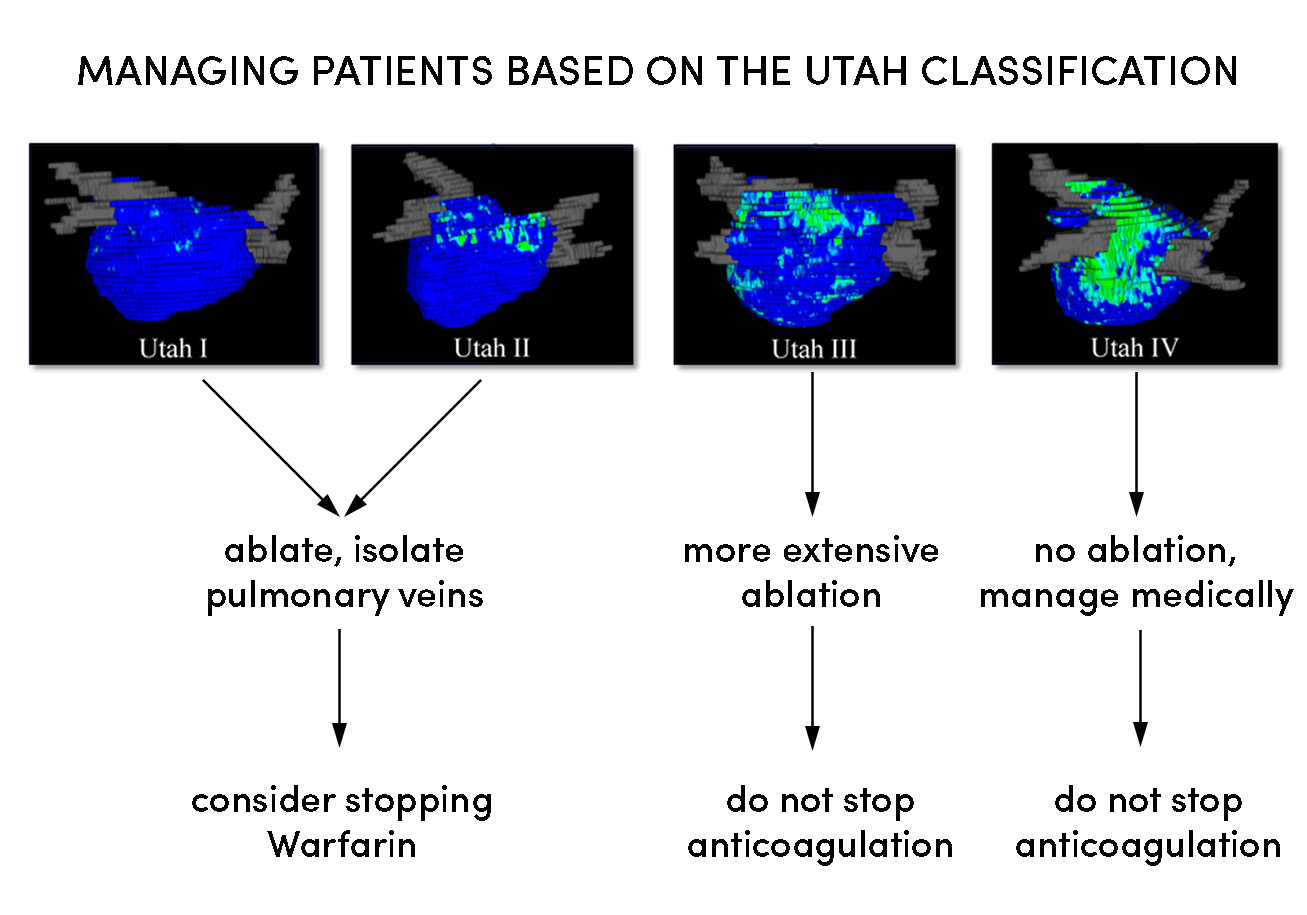
Thanks to the work Kholmovski and the CARMA team have done, a new model for managing Afib patients based on the extent of their fibrosis has emerged.
We will anxiously follow the great collaborative work of the CARMA team that puts MRI physicists together with cardiologists and computer visualization experts to create a new frontier for treating AFib patients.